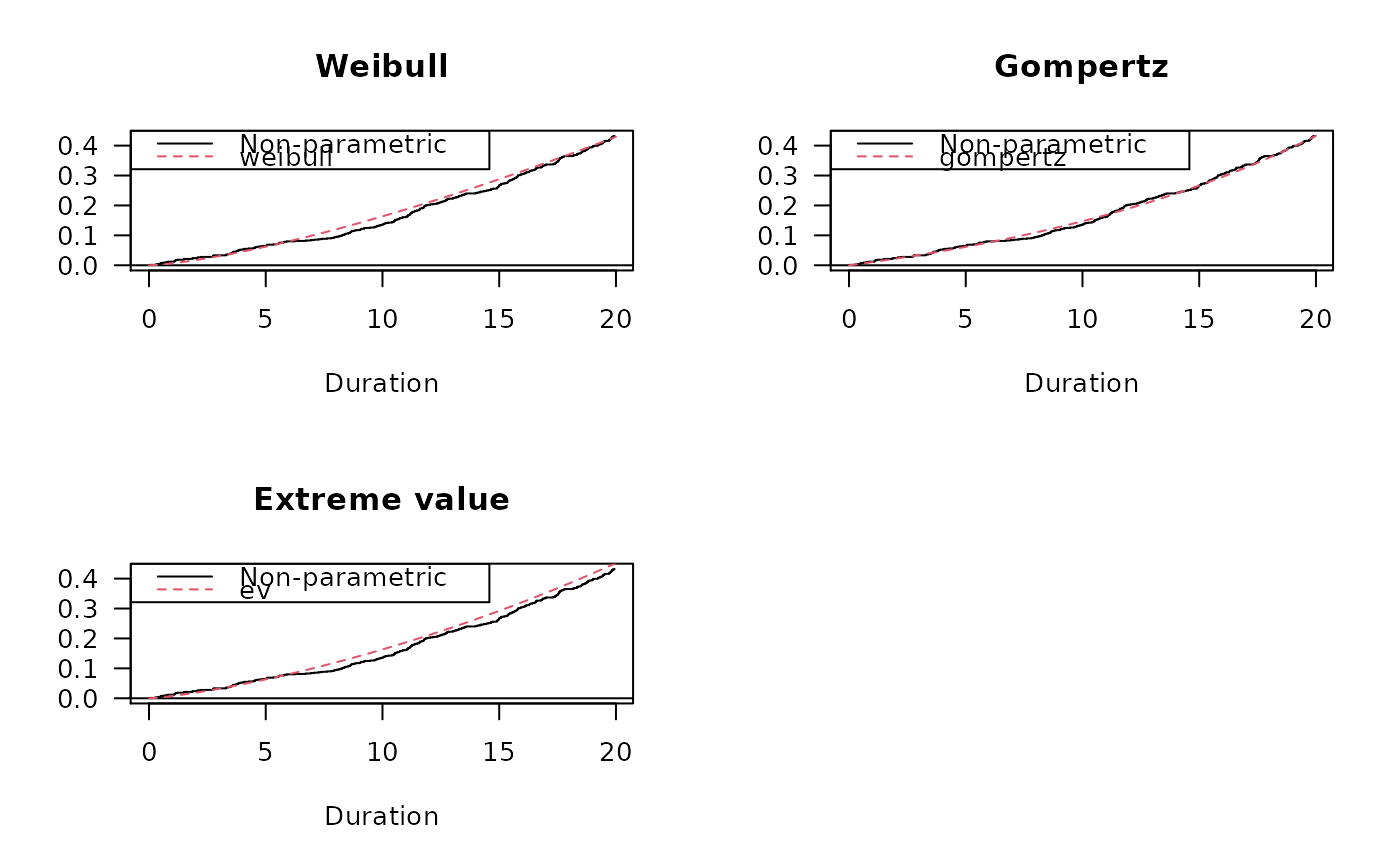
Comparison of the cumulative hazards functions for a semi-parametric and a parametric model.
check.dist(sp, pp, main = NULL, col = 1:2, lty = 1:2, printLegend = TRUE)
Arguments
| sp | An object of type "coxreg", typically output from
|
|---|---|
| pp | An object of type "phreg", typically output from
|
| main | Header for the plot. Default is distribution and "cumulative hazard function" |
| col | Line colors. should be |
| lty | line types. |
| printLegend | Should a legend be printed? Default is |
Value
No return value.
Details
For the moment only a graphical comparison. The arguments sp and
pp may be swapped.
See also
Author
Göran Broström
Examples
data(mort)
oldpar <- par(mfrow = c(2, 2))
fit.cr <- coxreg(Surv(enter, exit, event) ~ ses, data = mort)
fit.w <- phreg(Surv(enter, exit, event) ~ ses, data = mort)
fit.g <- phreg(Surv(enter, exit, event) ~ ses, data = mort,
dist = "gompertz")
fit.ev <- phreg(Surv(enter, exit, event) ~ ses, data = mort,
dist = "ev")
check.dist(fit.cr, fit.w)
check.dist(fit.cr, fit.g)
check.dist(fit.cr, fit.ev)
par(oldpar)